Now that spring is in the air, with the daffodils fully out and the pink blossom starting to look picturesque, let’s turn our thoughts to spring-cleaning and what tips we can apply, not to our house tidy-up, but to our data processes. Like the contents of that cupboard under the stairs, taking a fresh look at what redundant clutter we are holding onto is beneficial. I remember a chemistry teacher drawing an analogy between entropy and a teenager’s bedroom. The room naturally tends towards maximum disorder unless we put some energy in and tidy it up. Our data repositories and processes are the same, since we need to put effort in to keep the level of data chaos to a minimum. Also note that however much continuous effort we put in, it is always worth periodically taking a fresh look. The business world is fast moving and dynamic, with unexpected changes in company targets. Even if these changes are only small they can build up over time, and it pays to check that your informatics strategies remain aligned with your business needs. So it’s time to get your Marigolds and technological dusters out and have a fresh look at your current workflows to see what improvements might be possible. Five areas to get you started are given below.
1) Check your dictionaries: With careful ongoing maintenance this task will be less daunting, but it is still easy for redundancies and duplications to slip in (especially when combining dictionaries from different sources, such as across sites or from company mergers). Data chaos is guaranteed if there are multiple representations for the same term. Clear business rules are needed and should be agreed across teams.

2) Audit your capture and reporting workflows: Are the most appropriate reports being generated or have the business-critical questions changed, rendering reports outdated? Review the level of context being captured around results. Check if numbers are being rounded at the correct time. It is all very well reporting results to 3 significant figures, but rounding numbers prior to storage can lead to a huge loss in precision in downstream calculations.
3) Optimise your queries: As your repositories grow, are your data retrieval queries still running efficiently? Perhaps your SQL queries could do with some fine tuning or maybe your Warehouse could do with some restructuring. Two useful books are: ‘Oracle SQL Tuning’ by M. Gurry and ‘Building the Data Warehouse’ by W. Inmon.
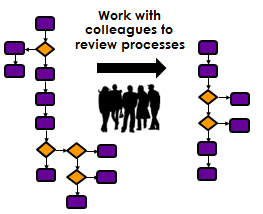
4) Work with colleagues to review current processes: Get out there and talk to people from different groups, taking a real interest in their everyday workflows and identifying the slow, mundane steps that they have to repeatedly carry out. Then assess the impact to prioritise tasks, remembering that sometimes perceived impact can be quite different from actual impact.
5) Stay up to date with current technologies: Attending conferences and reading literature is time well spent if it means identifying a new technology that improves processes. For example, check out the O’Reilly Radar blog or attend the Science and Information Conference.
Like a backlog of household chores, if all of the above seems overwhelming then why not get in an extra pair of helping hands, such as Amethyst, to help you sort through the mountain of clutter and prioritise your clear-up strategies. Sometimes all it takes is a fresh pair of eyes to ask the questions that need to be answered in order to polish up your processes. After applying the above techniques you will spend less time on manual error-prone steps and have more efficient processes and better quality data, therefore maximising your chances of making successful business-critical decisions.