All posts by Amethyst

When Less is More

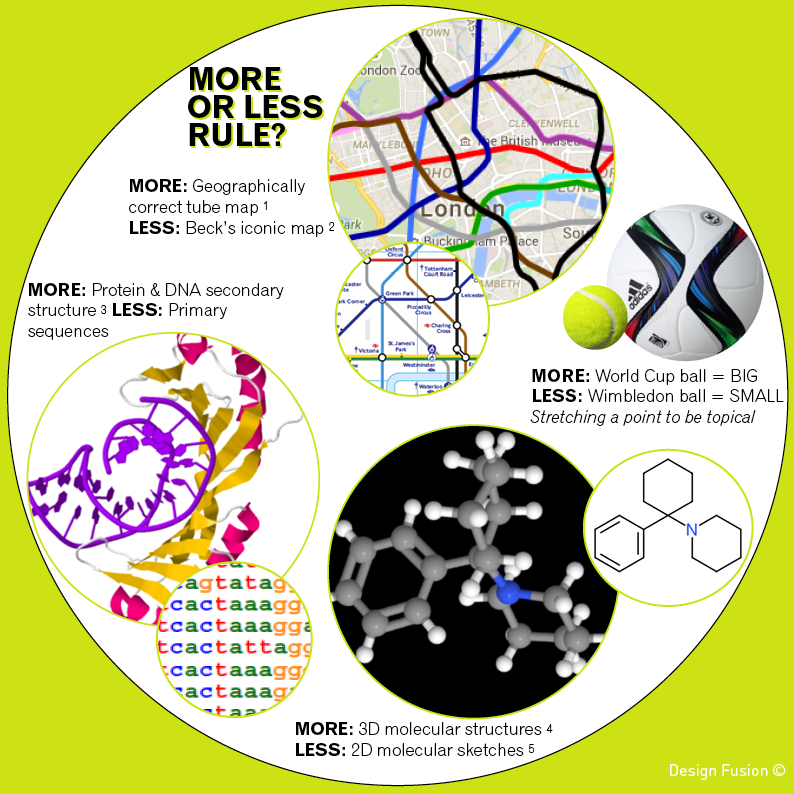
Recently Transport for London introduced a new version of their underground map to depict the Night Tube service that commences in September 2015.  In this fast paced, constantly evolving, modern technology driven city, it is a pleasure to see we are still using the same beautiful visualisation that was invented by Harry Beck over 80 years ago.  Beck recognised that it was far more important for the map to clearly illustrate the connections between tube stations rather than get lost in the true geographic detail.  His innovative idea is a very good example of how sometimes “less is more”.

Amethyst_blog_Jun15_image

The geographically correct version of the tube map (obtained via Google Maps) is shown above alongside of Transport for London’s map.  Both are useful and informative in their own right.  When planning my next underground trip Beck’s representation is a clear preference.  However, if the sun was shining and I wanted to walk part of my journey then I would head to Google Maps.

In science we often use the “less is more” approach to clearly and concisely communicate chemical structures to one another.  We flatten out the 3D geometry.  We don’t label every carbon, explicitly draw every hydrogen atom or get our rulers out to draw bond lengths to scale.  However, when modelling how a molecule interacts with a biological target then accuracy of 3D shape and charge distributions will be required.  Proteins and DNA are also represented with varying levels of information. Simple strings of letters are used when hunting for patterns in gene sequences, whilst a more detailed view of how proteins unravel DNA helps us understand how our genes are activated.

“Less is more” can also apply to machine learning.  With the era of big data upon us we have access to larger and larger data sets and may get tempted to use as much data as possible to build models.  However, using every single variable we can get our hands on runs the risk of producing over-fitted biased models that make poor predictions.

The longevity of Harry Beck’s underground map is a reminder of the importance of the “less is more” approach.  Visualisations can sometimes be made more powerful by stripping out information to focus on answering specific questions.

I could continue, but less might encourage you to come back for more.

REFERENCES

1. Geographically correct tube map from Google Maps
2. Beck’s iconic tube map
3. TBP/TATA-box complex from Kim et al 1993 Nature 365:512-520 (Protein Data Bank Entry 1YTB)
4. 3D structure of Phencyclidine obtained from ChemSpider
5. 2D structure of Phencyclidine sketched using ChemDoodle’s 2D Sketcher

Stolen Identity of an Informatician

I was recently asked, “Are you a Data Scientist?”  My answer: “Yes! I am an Informatician, which seems to be the same thing”.  A confused reply followed: “an inform-a-what?”

This got me searching the web and checking job role definitions.  The overlap between the two is huge and the overall goal of both is identical – turning data into knowledge.

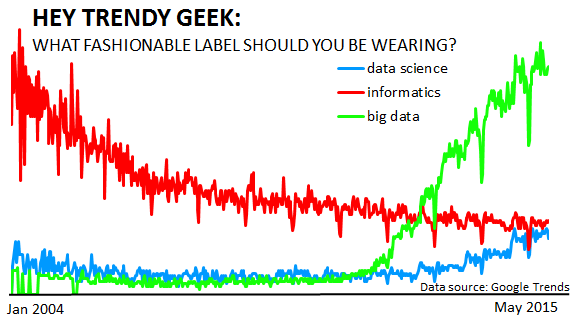
So what should I be calling myself?  Apparently Data Scientist is the “sexiest job of the 21st century”. Does this mean I should put my Informatics coat at the back of the wardrobe and wear the trendier Data Scientist designer label?  In order to answer this question let’s do the “Data Science/Informatics” thing and take a peek at some data (frequency of internet searches, source: Google Trends).

TrendyGeek

Representing term trendiness with the frequency of Google internet searches suggests that:

  • Currently “Data Science” and “Informatics” are equally cool
  • “Data Science” trendiness has been on a slight increase for the last couple of years. If this continues then “Informatics” is at risk of being out-trended by this time next year.
  • “Big Data” took off around late 2011 with a rapid rise over the last 3 years, making it the current chart topper. As data volume increases will the term “Big Data” be too small and replaced.
  • Could the increase in “Data Science” popularity be due to the “Big Data” era? At a glance the recent rise of the “Data Scientist” has occurred inside of the “Big Data” mountain, but this does not confirm any causal effects.
  • A decade ago “Informatics” was as sexy as “Big Data” is now.

There is an even newer phrase on the block, the Data Artist, an expert in visualising data.  One thing is very clear.  Whatever labels we choose to use, we all have a common goal.

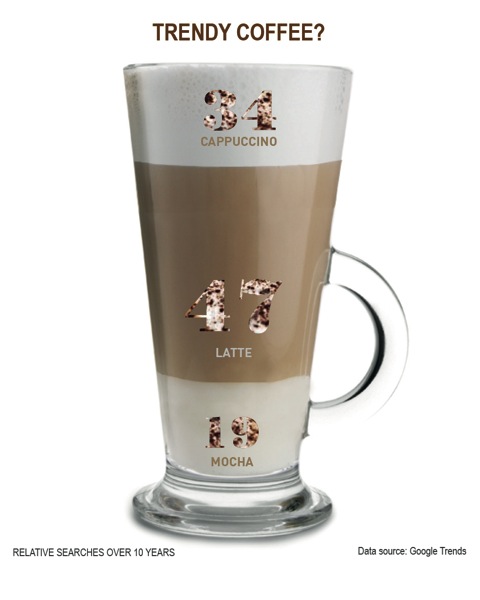
Since I am a chemist who extracts knowledge from data, I am going to stick to calling myself a Data Scientist… the “sexiest job of the 21st century”.  Off to have a quick coffee before cracking on with an informatics, data artistry and data mining analysis for my next client.  Now should I have a Mocha, Latte, Cappuccino with or without sprinkles hmmm?…  CoffeeCup

Spring-cleaning your data processes

Now that spring is in the air, with the daffodils fully out and the pink blossom starting to look picturesque, let’s turn our thoughts to spring-cleaning and what tips we can apply, not to our house tidy-up, but to our data processes.  Like the contents of that cupboard under the stairs, taking a fresh look at what redundant clutter we are holding onto is beneficial.  I remember a chemistry teacher drawing an analogy between entropy and a teenager’s bedroom.  The room naturally tends towards maximum disorder unless we put some energy in and tidy it up.  Our data repositories and processes are the same, since we need to put effort in to keep the level of data chaos to a minimum.  Also note that however much continuous effort we put in, it is always worth periodically taking a fresh look.  The business world is fast moving and dynamic, with unexpected changes in company targets.  Even if these changes are only small they can build up over time, and it pays to check that your informatics strategies remain aligned with your business needs. So it’s time to get your Marigolds and technological dusters out and have a fresh look at your current workflows to see what improvements might be possible.  Five areas to get you started are given below.

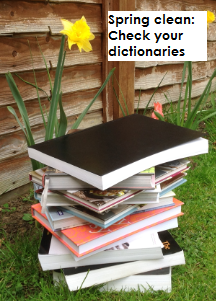
1) Check your dictionaries: With careful ongoing maintenance this task will be less daunting, but it is still easy for redundancies and duplications to slip in (especially when combining dictionaries from different sources, such as across sites or from company mergers).  Data chaos is guaranteed if there are multiple representations for the same term.  Clear business rules are needed and should be agreed across teams.

spring_dictionaries

2) Audit your capture and reporting workflows: Are the most appropriate reports being generated or have the business-critical questions changed, rendering reports outdated?  Review the level of context being captured around results.  Check if numbers are being rounded at the correct time.  It is all very well reporting results to 3 significant figures, but rounding numbers prior to storage can lead to a huge loss in precision in downstream calculations.

3) Optimise your queries: As your repositories grow, are your data retrieval queries still running efficiently?  Perhaps your SQL queries could do with some fine tuning or maybe your Warehouse could do with some restructuring.  Two useful books are: ‘Oracle SQL Tuning’ by M. Gurry and ‘Building the Data Warehouse’ by W. Inmon.

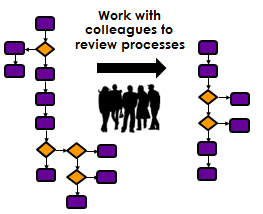
4) Work with colleagues to review current processes: Get out there and talk to people from different groups, taking a real interest in their everyday workflows and identifying the slow, mundane steps that they have to repeatedly carry out.  Then assess the impact to prioritise tasks, remembering that sometimes perceived impact can be quite different from actual impact.

spring_clean_processes

5) Stay up to date with current technologies: Attending conferences and reading literature is time well spent if it means identifying a new technology that improves processes.  For example, check out the O’Reilly Radar blog or attend the Science and Information Conference.

Like a backlog of household chores, if all of the above seems overwhelming then why not get in an extra pair of helping hands, such as Amethyst, to help you sort through the mountain of clutter and prioritise your clear-up strategies.  Sometimes all it takes is a fresh pair of eyes to ask the questions that need to be answered in order to polish up your processes.  After applying the above techniques you will spend less time on manual error-prone steps and have more efficient processes and better quality data, therefore maximising your chances of making successful business-critical decisions.

A Chemist’s Centenary Celebration of Pi

Amethyst_PiDay4Today is Pi Day; a day where mathematicians celebrate the mathematical constant π.  This year is extra special, since at the exact second this post was published time lines up with π to an amazing 9 decimal places (3.14.15 9:26:53) and this will only happen once a century.

A quick recap of π… It is the number obtained when dividing the circumference of any circle by its diameter. It is therefore a very useful little number in the world of Chemistry where we are very much concerned with circular and spherical shapes. So today let’s join the mathematicians in their celebration. Here are 3 (π to 0 decimal places) areas where π is used in chemistry with examples of how these areas have impacted our daily lives.

1)  Atomic and molecular orbitals.  π helps us calculate how the electron clouds in atoms interact to form molecules.  Let’s introduce the π orbital (a coincidental name).  These special π systems are pivotal to dyes and plastics.  Putting the colour in your jumper and making drink bottles and parts of your car.  Sometimes when electrons get excited and jump into higher energy orbitals we get fluorescence or phosphorescence.  Keeping you safe on your bike at night after partying with glow sticks.

2)  Formation of droplets, bubbles and micelles in surface chemistry.  Concerned with the favourable spherical arrangements made to best separate hydrophobic from hydrophilic.  The pop in your champagne, the moisturisers you put on your face, the soap powder you use to clean your clothes and how best to deal with oil spillages in the sea.

3)  Predicting protein-drug binding.  π is used in the calculation of  binding scores for possible conformations (shapes) of potential drug molecules in the binding pocket of a protein.  By predicting how drugs bind to their targets we can design effective new pharmaceutical treatments as well as understand how chemicals behave in our body.

Of course let’s not forget that, as well as being a numeric constant, there are many other amazing things that this greek letter is used to represent in science. Examples include: osmotic pressure (how plants take up nutrients), nucleotide diversity (a topic from molecular genetics) and the Pion (an important subatomic particle).

We have certainly covered a broad array of chemistry applications, so a big thank you to 3.141592653 and however many further decimal places you require.

Guardian Masterclasses Data Visualisation

Great class and opportunity to learn from the experts.  Housed in the creatively designed London offices of the Guardian.  A great set of hand-outs, excellent material and interactive group tasks that get you talking to people across industries.

Why not book a place now?  Next two advertised slots are the 14th March 2015 and 11th April 2015

I attended this course last year and would strongly recommend it to anyone wanting to learn more about infographics regardless of what sector you come from.  The room was filled with an exhilarating mix of developers, journalists, writers, graphic designers and researchers – an inspiring infusion of creatives, techies and academics.

The day including interesting discussions around the contrasting approaches of Edward Tufte and David McCandless.  Being a scientist I am naturally drawn towards the evidence based approach of Tufte, however I am equally drawn towards the exciting visuals of McCandless.