Tag Archives: Funnel Diagrams

Lead Optimisation Funnel Diagrams

VISUAL AID TO PROCESS IMPROVEMENT, REALISTIC GOAL SETTING AND RESOURCE MANAGEMENT

This article discusses how Funnel Diagrams can be used to make a positive impact on your lead optimisation projects.

Topics include: spotting process bottlenecks, confirming the successful impact of process changes, gaining insights into how achievable a goal is, taking a glance at how resources are split across multiple projects and assessing resource needs.

Two example lead optimisation projects that are at different stages are used to illustrate the funnel applications. An error bar extension to the original visualisation is presented.

Hirons L. Chemistry Today, August 2012, 30(4), 24 – 26

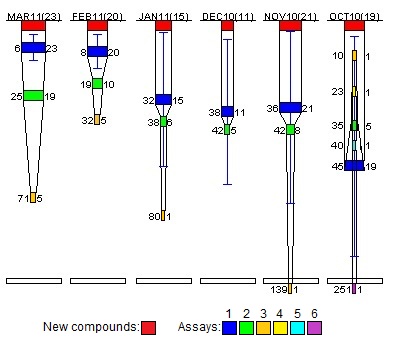
Funnel Diagram for project A:

Figure1

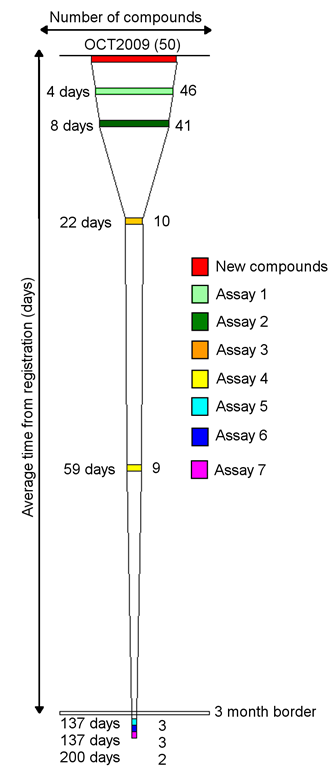
Funnel Diagram for project B with Assay 1 error bars:

Figure2

Novel Funnel Diagrams Published in Drug Discovery World

funnelThis article introduces Funnel Diagrams as a novel way of simultaneously viewing both attrition and time – two important factors to consider when applying process
improvement to drug discovery.

Hirons L, Johnstone C, Sambrook-Smith C. Drug Discovery World Winter 2011/12, 13(1), 44 – 49

A single funnel is shown to the right. Each rectangle represents an event. Rectangle width
represents the number of compounds processed by that event. The distance between a rectangle
and the top of the funnel represents the average number of days from compound registration to completion.

Attrition is therefore represented by changes in a funnel’s width and time by elongation of a funnel

Below is a funnel diagram that gives a six-month snapshot of a lead optimisation project. Each funnel represents a month
with a trellis of 6 funnels giving a summary of how processes are changing.

funnelDiagram

Highlights from the above diagram:

  • Changes in the number of new compounds can be seen by glancing across the red rectangles. The sudden change between
    May and June relates to the addition of chemistry resource.
  • In July the funnel folded back upon itself indicating an unexpected order of events
  • Assays 1 and 2 are consistently completed within a week of compound registration, regardless of the volume of requests – indicating a minimal impact area for process improvements
  • Variable timelines are seen for Assay 3, independent of throughput – an area to examine further